Executive Summary
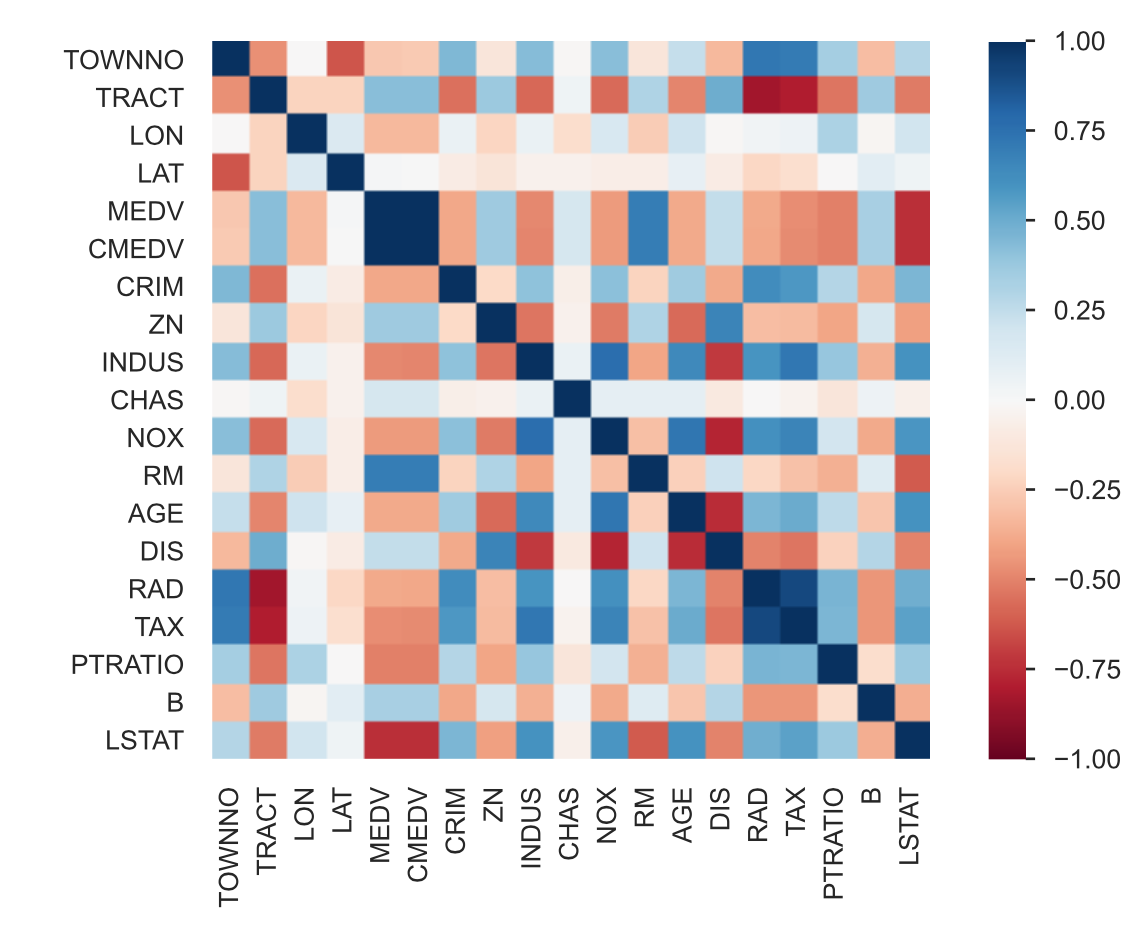
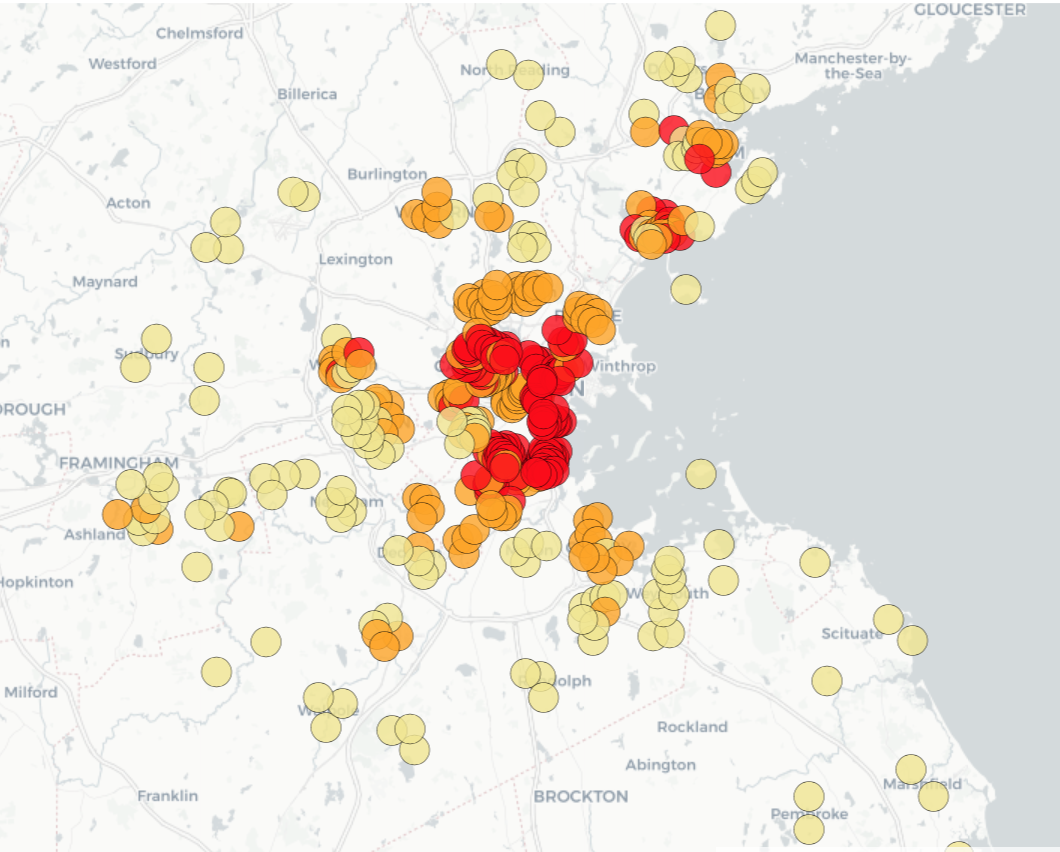
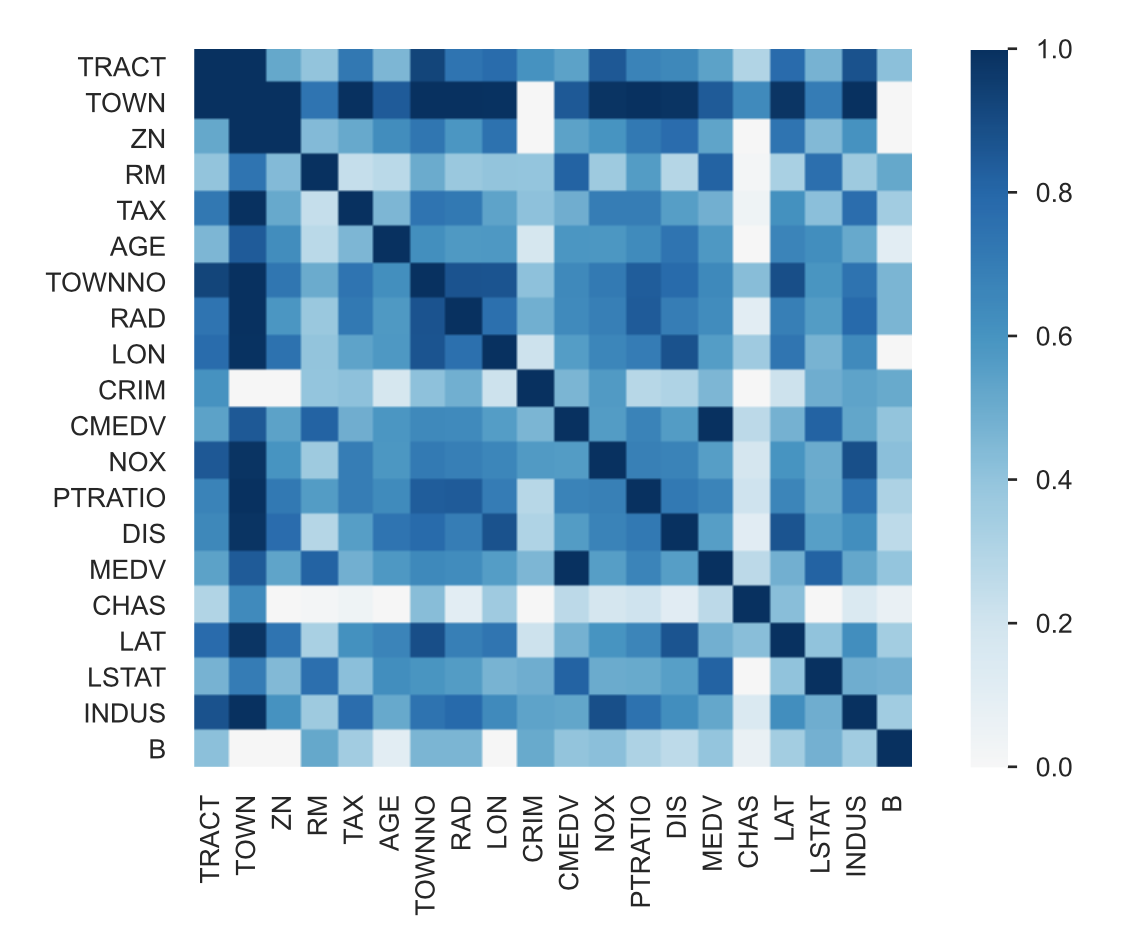
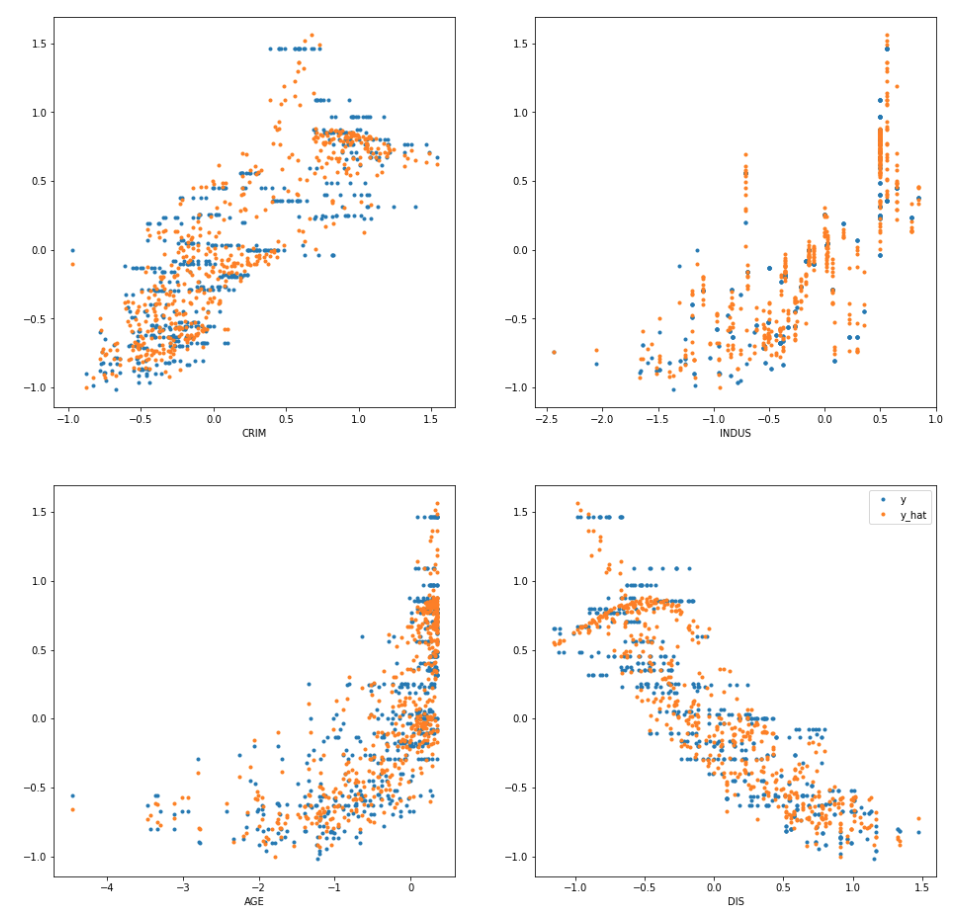
The Boston Housing Market dataset is ubiquitous but imperfect: with problems like small size, inconsistent definitions, incorrect coordinates and many many. However, it is still a very rich dataset containing informative geographical information, powerful socioeconomic indicators, and continuous levels of Nitrogen Oxides (NOx). This project explores the effect of developing low income neighbourhoods on NOx. This involves three logical steps: 1) Verifying that the dataset is rich enough to form clusters of economic class, 2) train a regressor for predicting NOx values, and finally 3) creating synthetic data simulating ‘improved’ low income neighbourhoods by bootstrapping values from higher income classes, while keeping geographical constraints fixed. To address the first issue, K-means is used to cluster the towns into 3 income classes (low, medium and high). The second point is achieved through a Support Vector Regression model achieving an accuracy of 88%. The last issue is addressed by means of replacing non-geographically constrained attributes of the low income cluster with that of a bootstrapped sample from the high inocome cluster. The evidence suggests that improving low income neighbourhoods does indeed decrease overall NOx levels, giving non-humanitarian reasons for supporting social uplifting policy. This project also corrects erroneous longitude and latitude values of the Boston dataset using Google’s geocoder API. The code and documentation for this project can be found here.
The aims and objectives of the project were defined as follows:
Explore novel avenues in famous Boston dataset
Typical projects with the Boston dataset focus on regression analyses on house prices, while others focus on a more geo-spatial analysis of the data (e.g. clustering). While both of these are quite interesting, our goal was to challenge ourselves by trying to answer a research question that could directly to policy recommendations.
Verify that dataset is informative to solve question
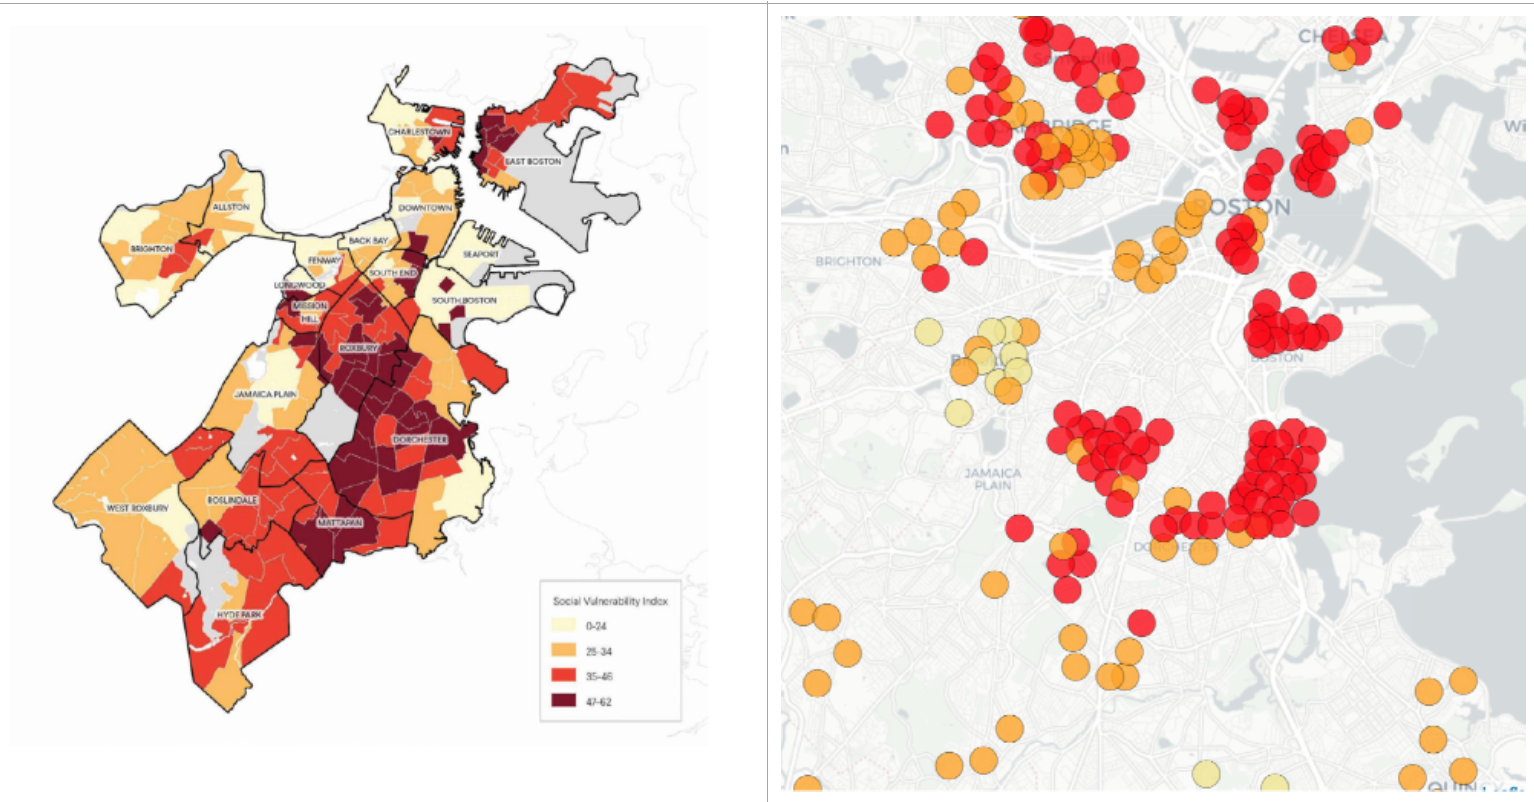
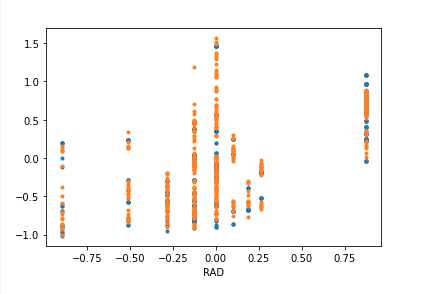
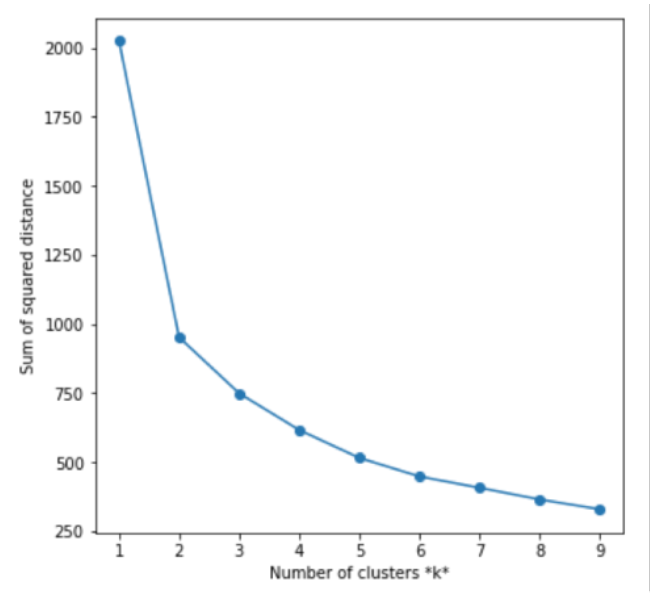
An important assumption our question makes is that the data is informative enough to create clusters of areas separated by income. Success Criteria: find clusters that are comparable to external literature.
Find the best model for predicting NOx levels
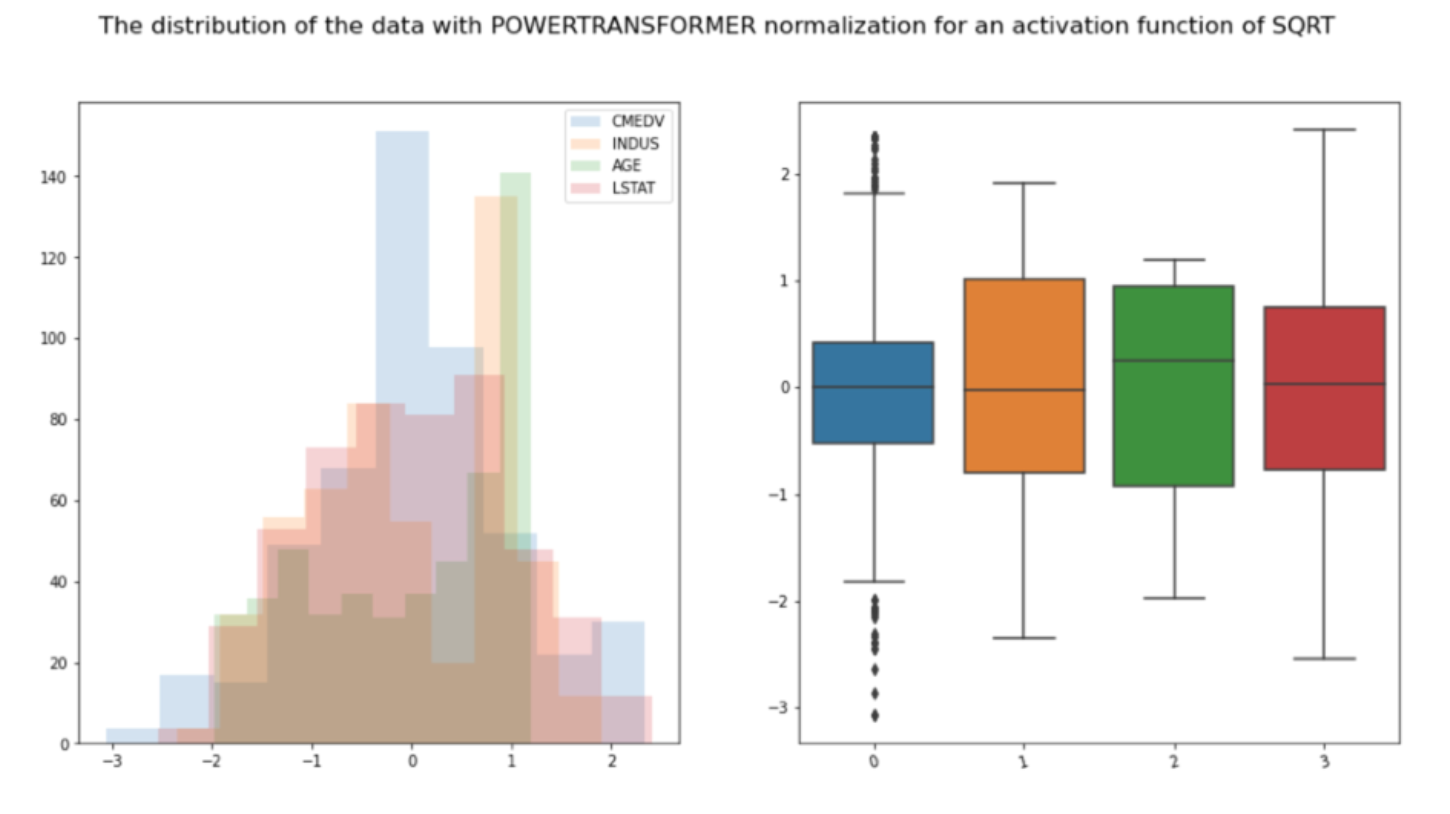
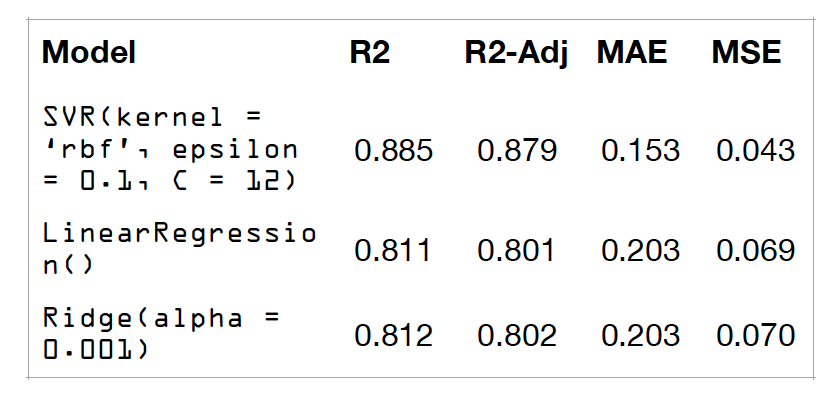
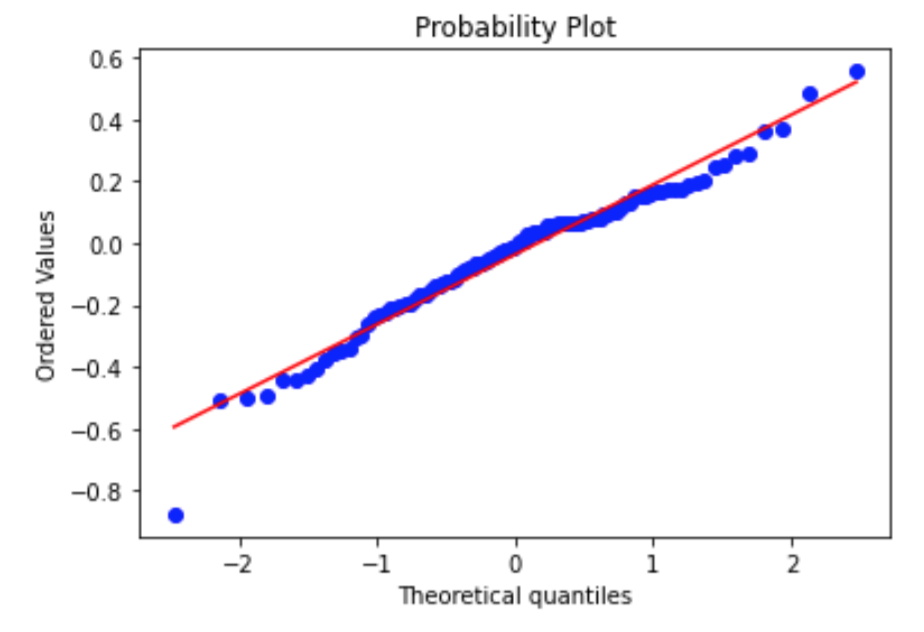
The project involves finding a regresion model to predict NOx levels, as well as choosing the best regressors for this. Success Criteria: find models that give high accuracy and normally distributed residuals.
Simulate 'development' in Low-income towns
This is the 'novel' part of this project. What does this mean that a town has been 'developed'? Are any parameters constrained, for example by geography? Are there socioeconomic parameters that could be changed by policy recommendations? Success Criteria: find a reasonable way to simulate 'development' in a low income town.